TAKE THE PLEDGE FOR A CRUELTY FREE UK
Pledge to help kick testing on animals out of our homes and ask your MP to stand up for animals in UK laboratories.
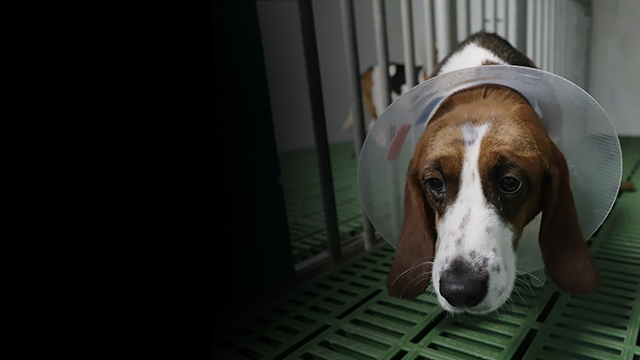
© Cruelty Free International / Carlota Saorsa
Cruelty Free International works to create a world where no animals suffer in a laboratory.
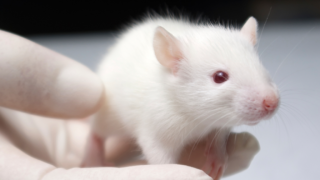
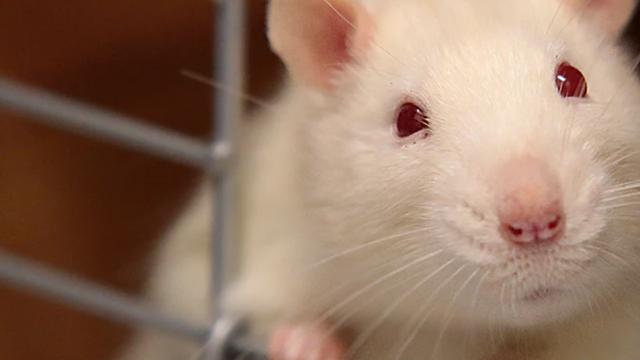
192.1 million animals
were used for scientific purposes worldwide in 2015
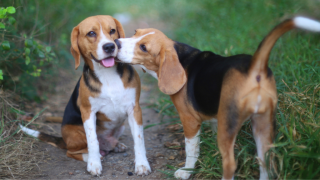
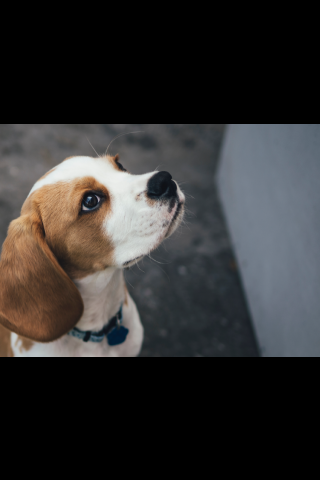
207,724 tests
using dogs are conducted worldwide
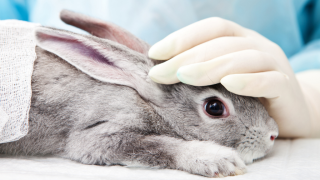
12.6 million animals
were bred for experiments in the EU but then not used
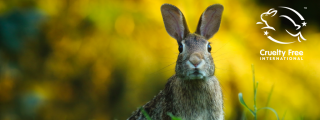
The Leaping Bunny Programme
The Cruelty Free International Leaping Bunny is the globally-recognisable gold standard for cosmetics, personal care and household products. Hundreds of brands are approved cruelty free under our Leaping Bunny programme.
We will not stop
We campaign to end animal experiments worldwide.
Be a hero for animals
subtitle: Get involved today and help us end animal testing worldwide.